Site Boundaries from Survey Maps
Acreage survey maps clarify the area and boundaries of a plot of land. When conducting architectural planning, the site's shape is reproduced based on these maps. Survey maps are often shared via PDF, paper, or existing design documents. While CAD versions may exist, they are not always accurate, so it is desirable to reproduce the shape precisely each time. The main methods for reproducing a site include coordinate area calculation tables and triangulation area calculation diagrams. Each takes a different approach, so it is helpful to understand both.
Coordinate area calculation tables require the input of coordinates. These can be entered manually or recognized via OCR. Additionally, having point names is beneficial because, depending on the shape, the orientation itself can sometimes be mistaken. This is due to differences between surveying coordinate systems and mathematical coordinate systems, as well as a lack of awareness of these differences in certain industries. There is also the potential for misrecognition or input errors with individual coordinate values.
With these considerations in mind, NijiCAD provides tools to create site boundaries reliably while minimizing the risk of rework. Furthermore, since point input and settings are handled systematically, you can transition seamlessly into drawing production.
Let's look at how to use these tools.
1. Launching the Command
First, select "Survey Map" from the "Tools" menu.
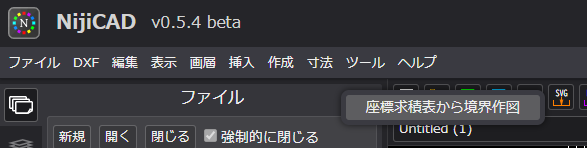
It can also be launched using the SOKUTEN command.
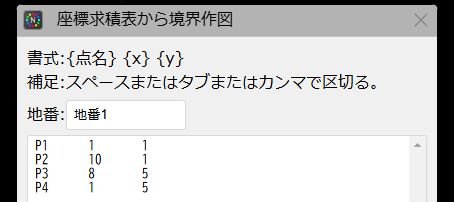
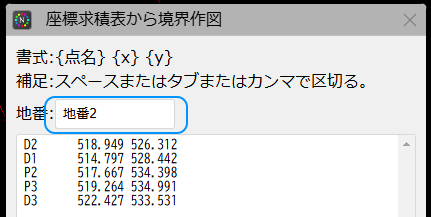
A dialog will appear containing sample point names and X/Y coordinate values. Enter the data from your coordinate area calculation table into this input area. Clicking the "Draw" button will generate the shape in one step.
2. Coordinate Input for Area 1
It is helpful to use spreadsheet software like Excel for this input. In this example, we will perform manual input, which takes about 2 to 3 minutes. If there are many items, you might use image recognition. By using spreadsheet software as an intermediary, you can quickly correct errors if they are discovered later.
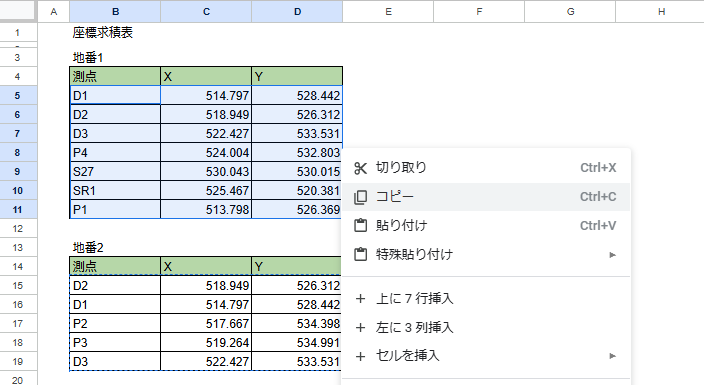
Once input is complete, copy and paste (Ctrl+C → Ctrl+V) the data into the dialog.
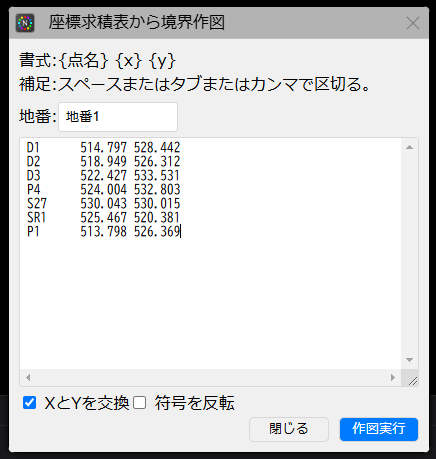
The "Swap X and Y" checkbox at the bottom left of the dialog is checked by default to convert to surveying coordinates. (Uncheck this if you are using mathematical coordinates.)
3. Generating Area 1
Click the "Draw" button to generate the shape.
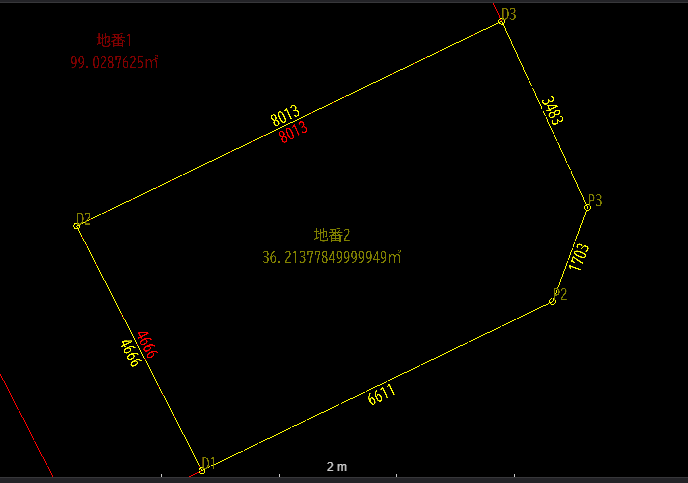
The key point for verification is the Area. If the data is entered correctly, the area should match down to every digit. If it doesn't match, there is an input error, and you must double-check the data.

The generation is complete.
4. Verification for Area 1
Compare the calculated area with the acreage calculation diagram.

5. Coordinate Input for Area 2
Continue by inputting the second area. The lot number has been changed from the original name to "Area 2" (地積2). This will cause a separate layer to be created.
6. Generation and Verification for Area 2
Click draw.
7. Preparing for Placement in Drawings
Once you have confirmed that the drawing is accurate, draw a paper frame. In this example, an A3 frame at 1:100 scale was used. The orientation is drawn arbitrarily with North pointing upwards. Move both the frame and the site to the origin.
If a paper frame is already created, move it into the frame using MOVE or COPYBASE/PASTE.
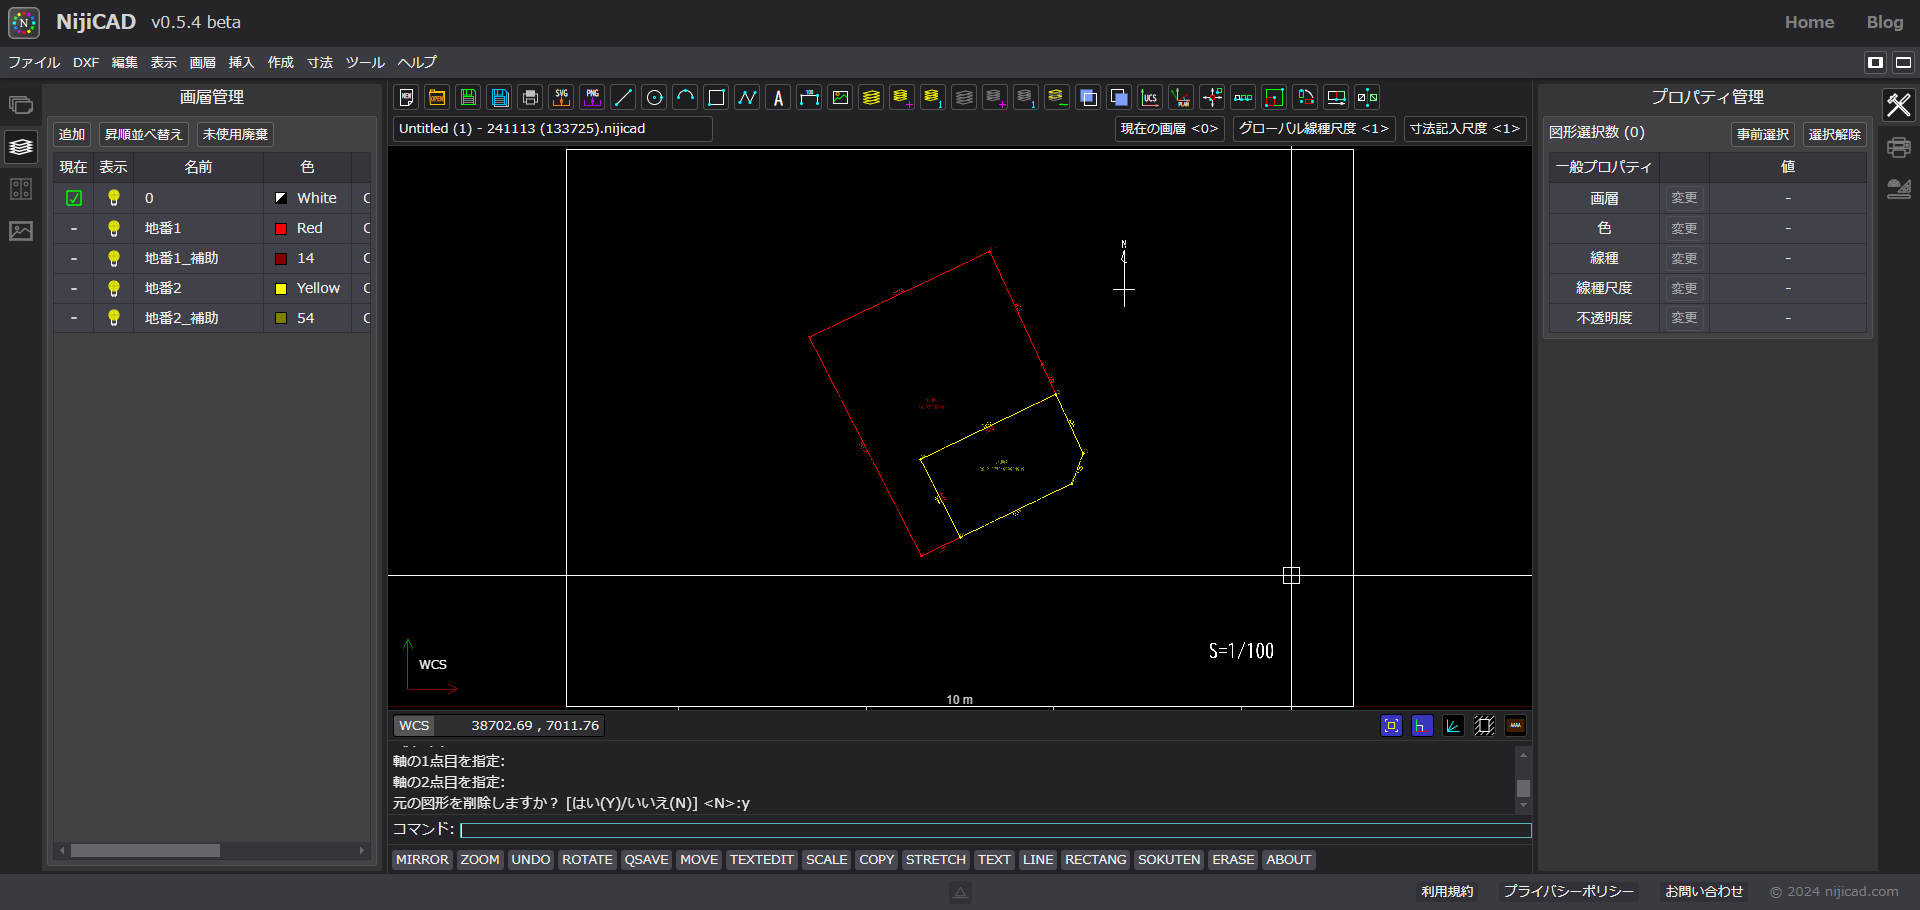
8. Rotating the Site
When rotating the site, do so together with the North arrow. In this case, we'll align the back boundary of the site horizontally.
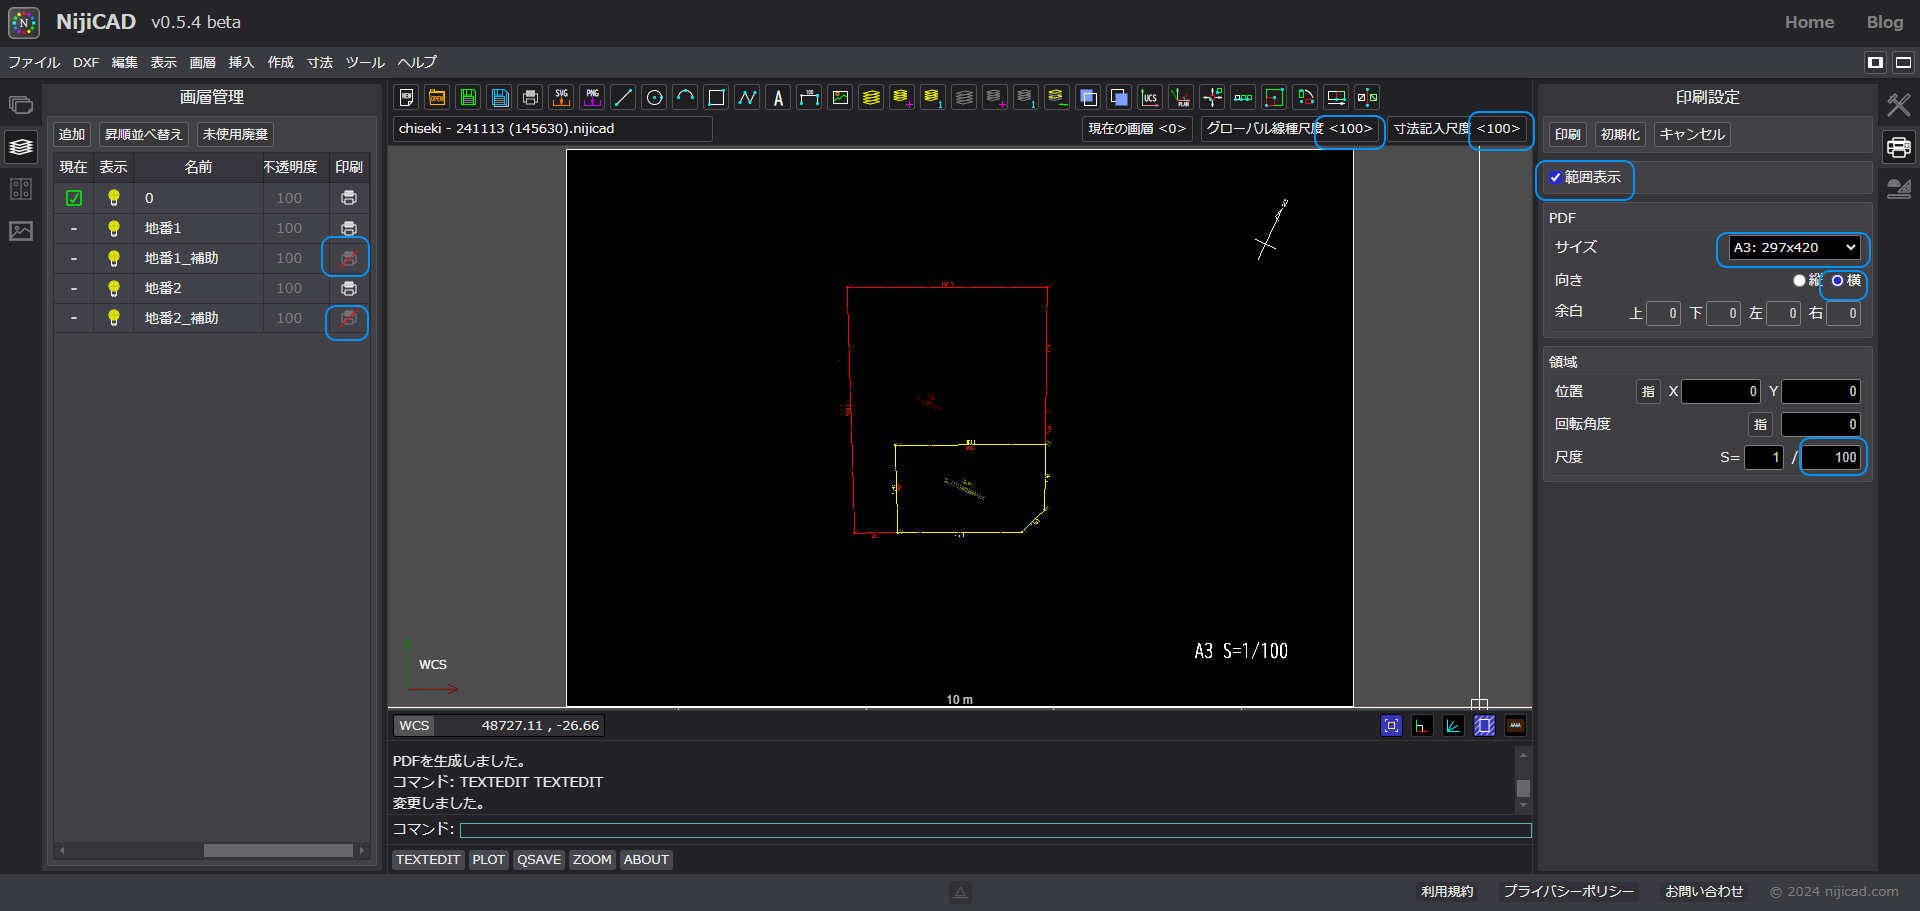
Additionally, set auxiliary layers to non-printing, and configure linetype scales and print settings.
9. Final Thoughts
Creating site boundaries from coordinate area calculation tables is not a frequent task. However, it is an essential step during the planning stage. While it is possible to make do with improvised drafting, it is much better to have a dedicated tool ready. NijiCAD is suitable for such specific tasks because it can be launched easily from a browser. The created drawings can be exported as DXF for reuse. We hope you find it useful.